Why Does Everything Feel So Expensive?
Inflation hit a 40-year high of 9.1% in June 2022.
Today, inflation is hovering around 3%.
If inflation is back in line with long-term historical averages, why does everything still feel so expensive?
When voters were asked what they would most like to see improved in our economy…
…why did 64% of them say “lower prices?”
In this episode, I’m digging into the current state of inflation, why prices still feel high, and where inflation might be headed.
I’m also sharing tactics for how to successfully navigate challenging time periods.
If, like most retirement savers, things still feel outrageously expensive to you, you’re going to enjoy this episode.
Listen To This Episode On:
When You’re Ready, Here Are 3 Ways I Can Help You:
- Schedule a Free Retirement Strategy Session. Get your questions answered + learn how we can help you improve retirement success and lower taxes.
- Listen to the Stay Wealthy Retirement Show. An Apple Top 50 investing podcast.
- Join My Retirement Newsletter. Weekly retirement and investing tips (delivered to our inbox!)
+ Episode Resources
📫 Join the Stay Wealthy Retirement Newsletter!
- February 2024 CPI Report:
- What is the Consumer Price Index? [Investopedia]
- Inflation Is Still in a Downtrend [Cullen Roche]
- Inflation in the Grocery Store [Ben Carlson]
- Let’s Be Thankful for Food Abundance [Jeremy Horpedahl]
+ Episode Charts
+ Episode Transcript
Taylor Schulte: According to the recent February inflation report, prices for consumer goods and services increased 0.4% last month and 3.2% for the last 12 months.
While inflation is back in line with long-term historical averages, most Americans aren’t feeling much relief. In fact, in a recent poll, when registered voters were asked, “What would you most like to see improved in the economy?” 64% said lower prices on goods and services. Only 20% of respondents said higher wages.
Now, in reality, consumer prices in the aggregate don’t really go down, and therefore we shouldn’t expect or demand lower prices in the future. In fact, a general decline in prices, also known as deflation, would signal that trouble is around the corner for the economy.
Inflation, as a reminder, measures the rate of change in prices, and on average, over the last 110 years, that rate of change has averaged just over 3% per year. In other words, overall prices for consumer goods and services in the United States have only gone up for the last century.
Prices going up isn’t what shocks consumers’ wallets – it’s the rate at which prices go up.
But now that prices today are increasing at a more reasonable rate than their 9% peak in 2022, why does everything still feel so expensive? Why are consumers still feeling like prices are putting a strain on their budgets and demanding lower prices?
Welcome to the Stay Wealthy podcast, I’m your host Taylor Schulte, and today, I’m digging into the current state of inflation, why prices still feel high, and what the data suggests about where we are headed.
To grab the data sources and links from today’s episode, just head over to youstaywealthy.com/214.
Inflation Is Cooling…But Why Does Everything Still Feel So Expensive?
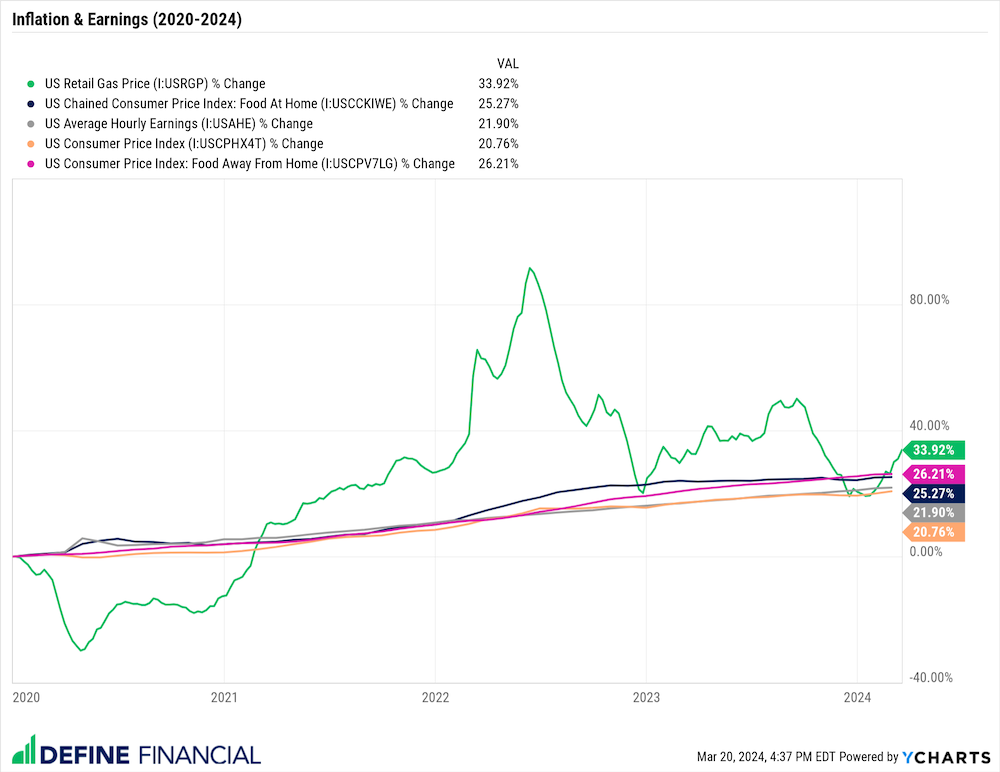
Since January 2020, prices across the board for consumer goods and services, as measured by the Consumer Price Index, have increased by roughly 21%. It sounds like a big number, and it is, but it’s important to add that average hourly wages in the U.S. have increased by about 22% during the same time period.
In other words, average earnings by American workers have slightly outpaced the rise in prices over the last four years. Purchasing power, on the surface, appears to have been protected.
So, why does everything feel so expensive, even after factoring in the growth of wages?
At the end of the day, the two things people care most about—and pay the most attention to on a daily basis—are food and gas prices. And since 2020, prices for both have not only outpaced inflation but also average hourly wages. Specifically, food at home (i.e., groceries) has increased by 25% since 2020, food away from home (i.e., dining out) has increased by 26%, and retail gas prices have increased by 34%.
Technically, when factoring in the growth in average hourly earnings, everything is not more expensive. However, the things people care about most and pay attention to are more expensive. Food and gas prices have outpaced both broad-based inflation and wages over the last four years.
And that’s likely part of why people are feeling a disconnect between the recent 3% inflation reports and what they are actually experiencing in real life. The things they pay the most attention to and purchase most frequently have increased in price rapidly, and have outpaced both inflation and hourly earnings over the last four years.
Similar to evaluating asset classes and investment options, zooming out and looking at longer-term inflation trends can help us make more sense of today’s environment and potentially help us feel more optimistic about where we’ve been and where we’re headed.
With that in mind, let’s rewind back to the year 2000.
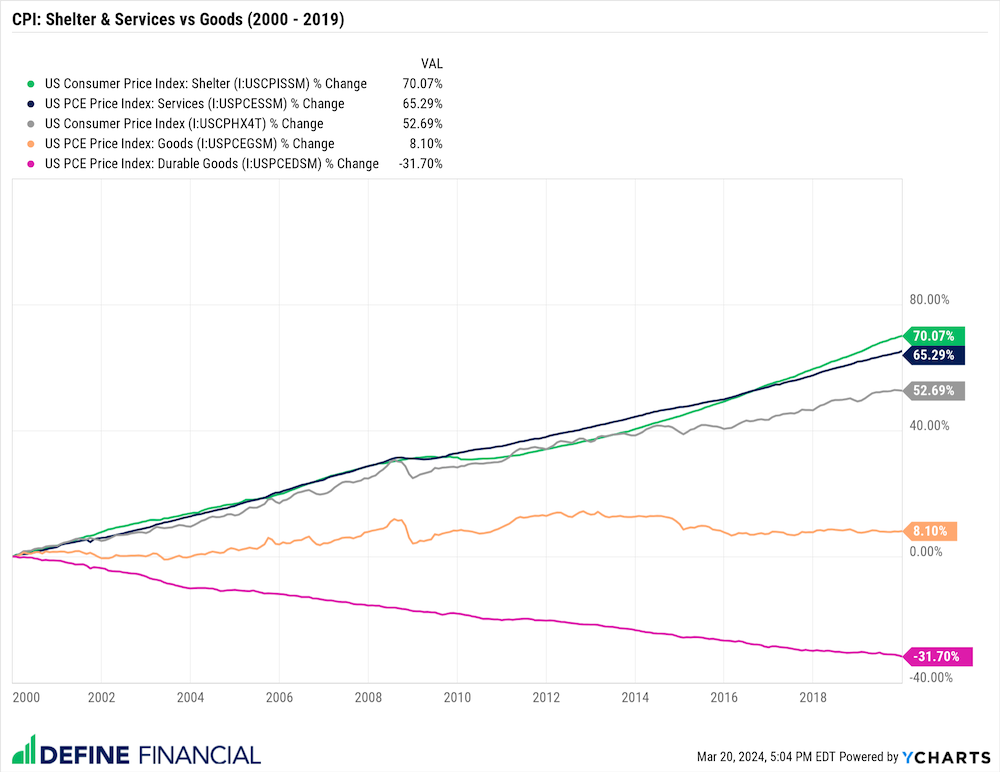
From January 1st, 2000, to the end of 2019, a 20-year time period, the US Consumer Price Index (i.e., inflation), increased by 52%. Said another way, the inflation rate averaged around 2.5% per year during those 20 years.
Remember, the Consumer Price Index (or CPI) measures the overall change in consumer prices for goods AND services in the United States. In other words, it’s a broad measure that represents a wide variety of spending categories and doesn’t necessarily provide the best perspective of what’s happening in the economy. When you look under the hood, things get a little more interesting.
For example, if we drill down and isolate price changes for “consumer goods” only, we find that prices were more or less unchanged during that 20-year time period from 2000 – 2019. In fact, if we drill down even deeper, prices for durable goods – things like electronics, appliances, toys, furniture, etc. – prices for durable goods actually went down during that time period.
And it makes sense when you think about it, lower-cost overseas labor, innovation, and technology have helped drive down the cost of making things, like the computer in your pocket or the flatscreen in your living room, or the shirt on your back.
So, while inflation averaged about 2.5% during that 20-year time period starting in the year 2000, most of the price increases felt by consumers were driven by shelter and services. More specifically, shelter and services outpaced the Consumer Price Index during that time period by about 20% and 15%, respectively. Food prices did increase in price, but by much less than the average inflation rate. Shelter and consumer services are what contributed most to the inflation numbers reported from 2000 to 2019.
Fast forward to today, and not only have Americans seen prices for shelter and services continue to outpace the average rate of inflation, but we’ve also seen, for the first time in a long time, prices for nondurable goods like groceries increase by more than inflation.
And I think this helps to explain at least some of the disconnect between what recent inflation reports and optimistic economists are saying vs what consumers are actually feeling. On top of prices continuing to increase sharply for shelter, services, and gas for the last four years, prices for things consumers care most about – and pay the most attention to (like food) – have been increasing above and beyond the average inflation rate for the first time in over two decades.
Another observation that I think helps to explain some of the disconnect comes from Ben Carlson, who recently shared a snippet of Robert Gordon’s work on consumer budgets and spending in the United States.
In short, Robert’s research concludes that Americans spend far less on food and clothing today than in previous generations. For example, in the early 1900s, consumers spent around 50% of their budget on food and clothing. Today, it’s closer to 15%.
As Ben puts it, “
While the food share of disposable income has risen in recent years, it’s been in a massive drawdown for decades. So it really depends on your frame of reference. People only notice when things are getting worse. No one ever pays attention when things get better.”
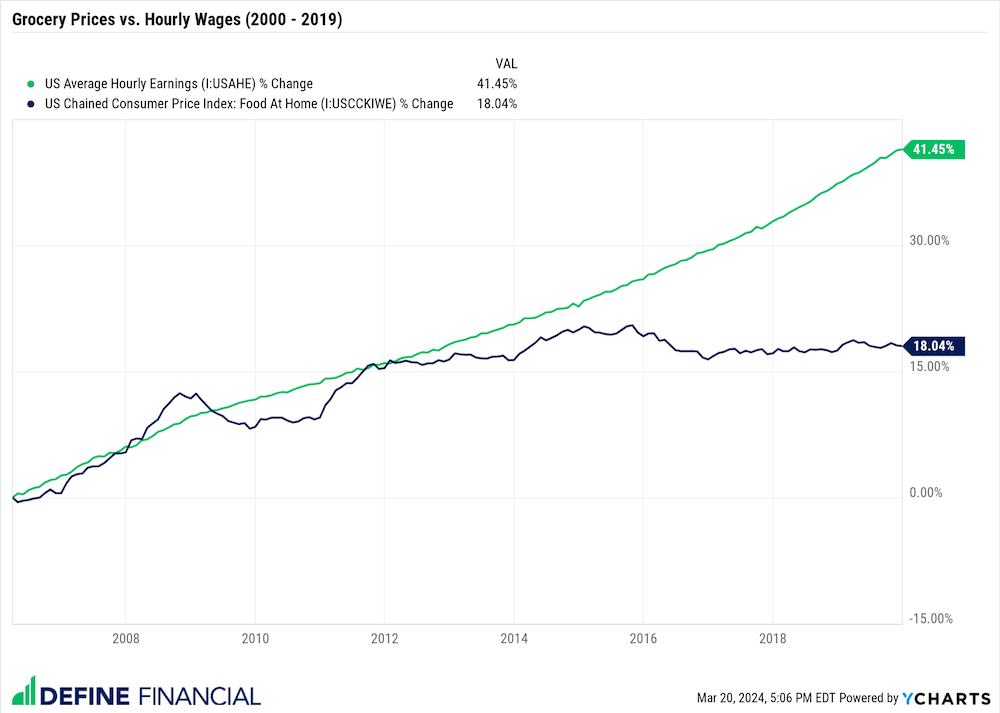
Speaking of when things are better, during the 20 years from 2000 to 2019, grocery prices only increased by about 18%…less than 1% per year, on average. On the other hand, US average hourly earnings increased by 41% during that same time period.
Ben hits the nail on the head:
“It makes sense that we complain when things get worse but don’t celebrate when things get better—and that’s because losses sting twice as bad as gains make you feel good.”
The other interesting point he makes is that we all have so many more necessary recurring expenses today than prior generations ever had. Thousand-dollar computers in our pockets, high-speed internet, streaming services, recurring software subscriptions, the list goes on.
In addition, student loans are at all-time highs, and everyone is paying more for healthcare today than ever before.
As Ben notes,
“I think this is one of the reasons higher food prices are so painful for so many households. There are so many other budgetary line items these days that an increase in grocery store prices becomes even more painful.”
Before we wrap up with where inflation and prices might go from here, I want to acknowledge that averages, of course, don’t tell the whole story. I’m not naive to the fact that there are people whose wages have not outpaced inflation and that there are people who have lost purchasing power and who are truly struggling in today’s environment.
On the other end of the spectrum, there are people thriving, making more money than ever before, with more money in the bank than they’ve ever had. Everyone is in their own unique situation, but struggling or thriving, the consensus, at least from my point of view and the conversations I’ve been having, is that, “everything still feels so expensive.”
While things cost a lot more today than they did four years ago, and the last four years have been far from easy, zooming out and looking at the longer-term picture should hopefully provide a better perspective than the headlines and chopped-up news clips that are shoved in front of us every day.
We’re going to have good years and bad years, good decades and bad decades. But we feel the pain of those difficult times twice as much as the equivalent good times. One way to combat this uncomfortable feeling is more or less what I attempted to do today – to zoom out and revisit where we’ve been over a longer period of time.
Changing your reference point can help change how you feel about a particular situation. In addition to changing your reference point during difficult time periods, reminding yourself there is light at the end of the tunnel and better days are ahead can help shift your mindset and get you thinking about future opportunities instead of dwelling on current challenges.
On that note, as listeners know, I’m not one to pretend to have a crystal ball, but I think it’s constructive to leverage current information and smart, unbiased experts to make educated assumptions about the future.
Much like me, friend and guest of the show, Cullen Roche, reminds us to keep the big picture in mind in his recent article about where he believes inflation is headed, stating that the data clearly shows inflation is in a downward trend. That, while the rate of change has slowed recently, it’s largely due to seasonal quirks and the lagging, slow moving beast that is shelter.
In other words, he argues that the shelter component of CPI, which is backward-looking, is driving up current inflation readings. Unlike food and energy, shelter prices move slowly, and we may not see shelter prices moderate to normal levels for another 12-18 months.
As Cullen put it,
“These short-term inflation readings will cause a near-term overreaction in the course of a much longer downward trend.”
He continues by saying,
“A little patience and discipline is all we need here. Before long, we should see a continued downtrend in the pace of disinflation that spoiled us in 2023.”
Once again, to grab the links and resources mentioned in today’s episode, just head over to youstaywealthy.com/214.
And don’t forget to join the Stay Wealthy newsletter if you haven’t already. As a thank you, you’ll receive three of my most popular retirement cheatsheets. To join, visit youstaywealthy.com/email. I’ve also included a link in the episode description directly in your podcast app.
Thank you, as always, for listening and I will see you back here next week.
Disclaimer
This podcast is for informational and entertainment purposes only and should not be relied upon as a basis for investment decisions. This podcast is not engaged in rendering legal, financial, or other professional services.